design.techknomatic – Just another WordPress site

We design

dashboards for making informed decisions.

Find hidden business insights with immaculate dashboard designing.

92%

Faster decision making with better dashboard designs*

Your business needs clutter-free dashboards for making informed decisions.

Our team at Techknomatic helps enterprises design dashboards, which cover all the critical data points required for data-driven decision-making. With our Dashboard UI/UX experience, we assist you translate spreadsheets and simple dashboards into stunning and intuitive dashboard designs. Presentable and quick to infer.

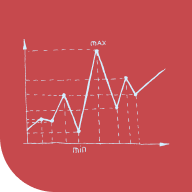
Why dashboard designing?

Spreadsheets leave your stakeholders fiddle with the corporate data, investing time to refine, summarize, mix, and present. And presentation drains a significant chunk of time with limited designs and chart options.


Dashboards make it easier to invest time in what is more critical: decision making.

Communicate information quickly

Display information clearly and efficiently

Highlight critical data points for quick action

Improves usability with sharing

Make essential information immediately accessible

Provides intuitive UI to convey instructions and actions

About Us

When you work with Techknomatic, you work with a dedicated and expert team of UI designers, business analysts, and dashboard designers. With our clean, simple, and creative dashboard designs, our experts help clients like you.

We help you ace in designing strategic, analytical, operational, and informational dashboards required at all the positions and departments.

Get a Quote
  • Best designs to match your brand guidelines
  • Quick turnaround time
  • Cost effective design solutions

10+

years of experience

100+

projects delivered

1000+

dashboards designed

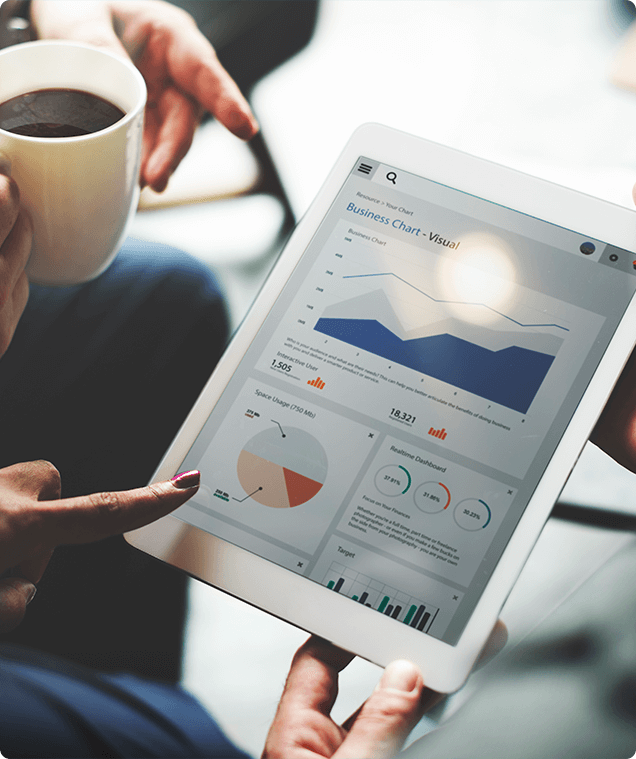
Get a consistent dashboard experience across all the devices

We design dashboards establishing visual, technical, and emotional consistency in each interaction, whether on mobile, tab, desktop, TV, or a giant screen

No matter how technically complex your dashboard requirement is, we make it simple and comprehensible. We follow modern design aesthetics that enable your dashboard to glow.

Mobile

Get mobile compatible dashboard designs for quick insights on the go

Desktop

Monitor business dashboards through any desktop devices

TV/Large Screens

Project your business dashboards on larger screens for monitoring

How It Works?

1

Requirement

Share your excel sheets or existing reports and dashboards with KPIs— your crucial business measures and parameters.

2

Ideation

Discuss and finalize themes, layouts, colors, and icons for your dashboards to match your branding.

3

Prototype

Get result-focused design prototypes prepared to match your brand guidelines, and review them for improvement.

4

Implementation

Develop and integrate the dashboard designs. Choose your preferred BI tool from a stack of proven platforms.

5

Revisions

Review the dashboard designs with data for another round, and we refine the designs based on your feedback.

6

Final Delivery

After the amendments to accommodate your reviews, get a walkthrough of the final designs and dashboard usage.

Tools We Use

Our Client List

Case Studies

Baltic seashore - unprocessed
Baltic seashore - warmshphere preset applied
Baltic seashore - unprocessed
Baltic seashore - warmshphere preset applied

Make your important business decision with a data driven approach

Request Demo
Testimonial

Stories From Our Customers

Director – Technology,

Fortune 100 company

Techknomatic was hired for a small performance optimization PoC. we ended up making them our engineering partners for all the visualization related requirements. It’s been 3 years and they have designed, developed, delivered and maintained 400+ dashboards for us.

Delivery Manager

Sales and Marketing consulting firm

Techknomatic is one of exemplary partner demonstrating “Constant Innovation, Courage over Comfort, efficacy towards sharing right talent for delivering out-of-box analytical solutions”. Impressive to see the exponential growth of Techknomatics in terms of expertise across varied skillsets and people headcount.

Analytics Head

Fintech Company – India

Techknomatic has supported us in all the visualization needs from environment setup to delivering dashboards for our CXOs. They have become part of our delivery team and help us in every step of our project strategy, delivery and support.

BI Head

IT Consulting Firm - Singapore

Our internal team created 15-20 dashboards for our internal operations platform. We contacted Techknomatic to re-designing these dashboards for better UI. The re-designed dashboards by the Techknomatic team were eye-catchy, attractive aa well as intuitive. This team understands the user experience and dashboard design very well.

Analytics Head

Fintech Company – India

Techknomatic has supported us in all the visualization needs from environment setup to delivering dashboards for our CXOs. They have become part of our delivery team and help us in every step of our project strategy, delivery and support.

Associate Principal

Management Consulting Firm

Techknomatic is going beyond the project delivery and helping us build off the shelf visualization solutions and accelerators for our clients. They have expertise in end-to-end visualization projects and sometimes the team forced us to re-think on our visualization strategies.

Contact Us

Have a Question?

Whether you are curious about solutions, partnerships, or technologies to use – we’re ready to answer all questions


    Get In Touch

    Just pick up your phone and
    connect with our sales team

    visit us :

    3rd Floor, Srushti Elegance,Baner, Pune,
    Maharashtra 411045